|
Enlisted Accessions
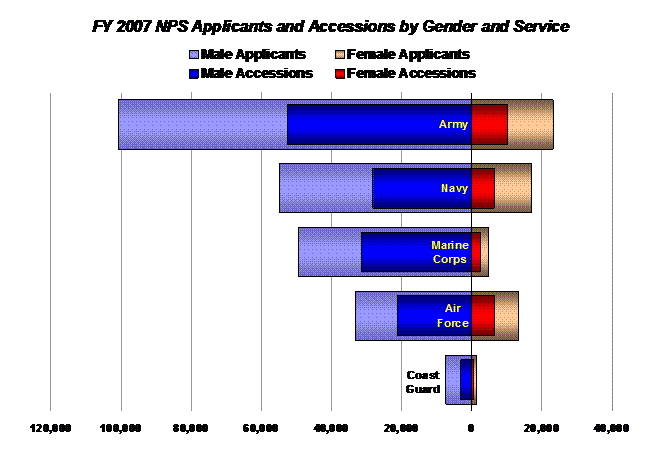
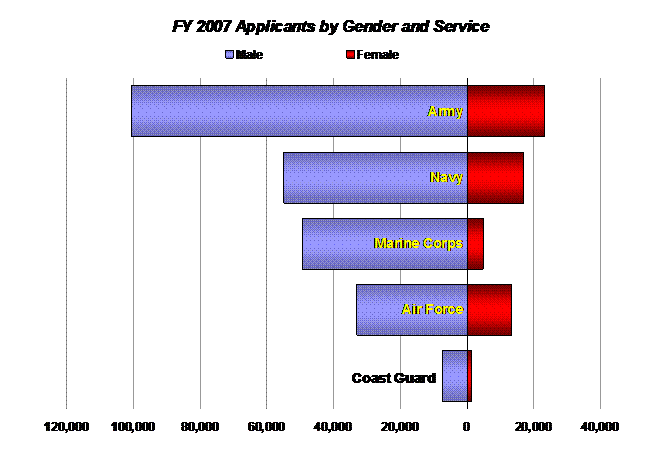
In FY 2007, over 133,600 men and almost 26,000 women
without prior military experience enlisted in one of the four DoD active
components. Roughly 3,100 men and 570 women without prior military experience
joined the Coast Guard. These enlistments represent over 55 percent of male
applicants and 43 percent of female applicants for FY 2007.
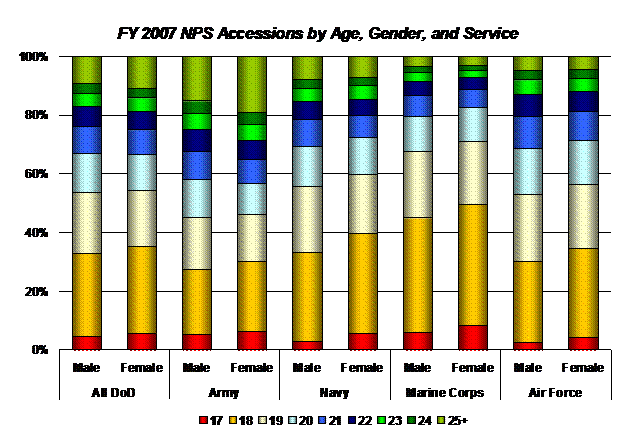
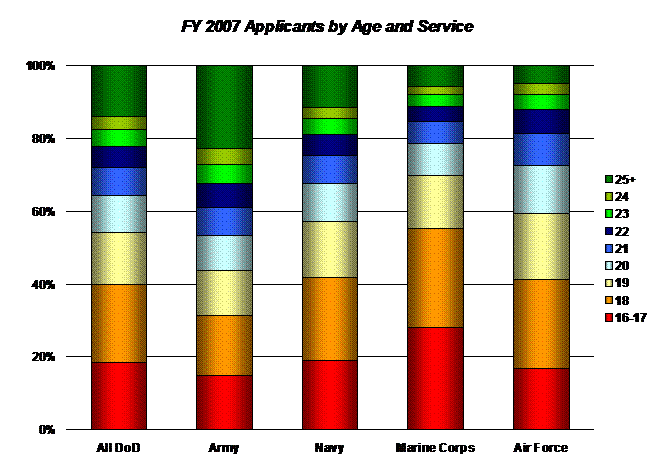
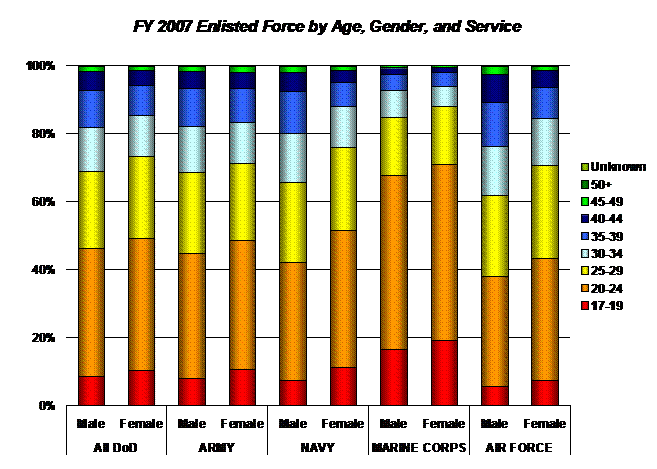
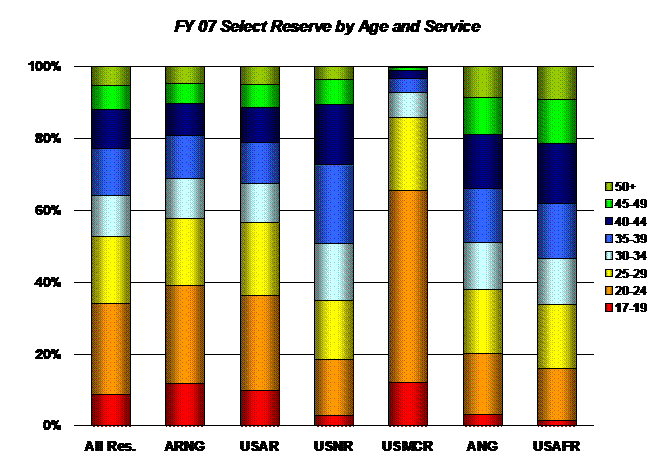
For all armed services, more than half of individuals
who enlisted during FY 2007 were under the age of 20. As with the applicant percentages, the Marine
Corps had the largest share of young recruits: 68 percent of those who joined
the Corps were under 20 years of age. The Army had the largest share of older
recruits: 16 percent of Army enlistees in FY 2007 were 25 years of age or
older.
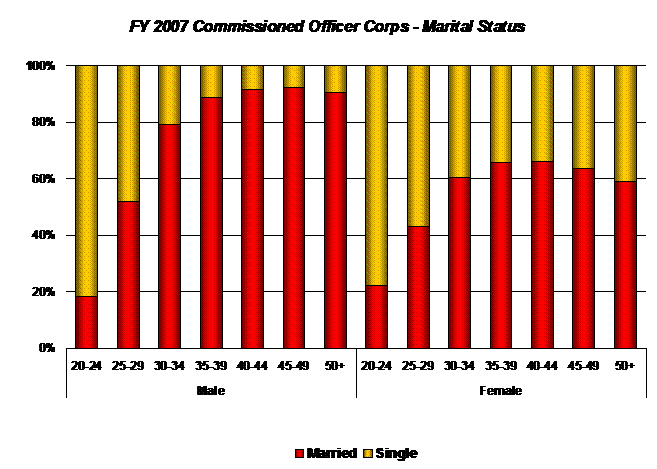
Women who chose to enlist in the Army were essentially
just as likely as men to be less than 20 years of age: 46 percent of female
Army recruits fell into this age group, while 45 percent of male recruits did
so. However, in the other three services, the proportion of female recruits
under the age of 20 was roughly 4 percentage points higher than the
proportion of male recruits in this age group.
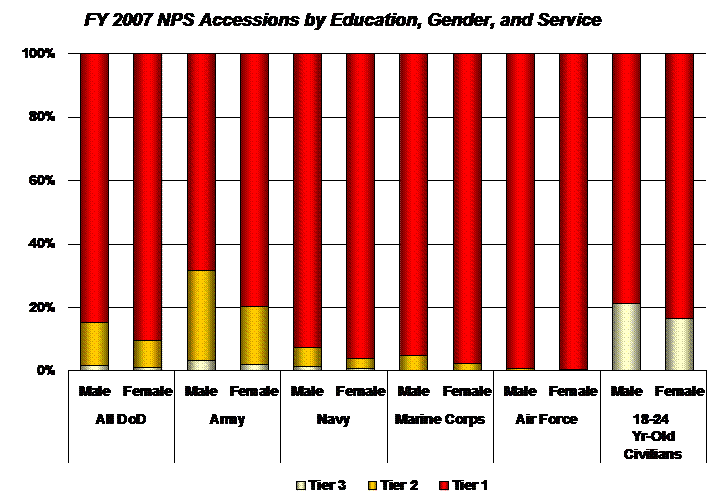
In addition to AFQT scores, educational credentials
represent an important component of applicant quality as measured by the DoD.
Educational credentials are used to group individuals into one of three
tiers:
|
Tier 1:
|
High school diploma graduate or some
college credit
|
|
Tier 2:
|
Alternate credentials, such as the
General Educational Certificate (GED)
|
|
Tier 3:
|
Non-high school graduate
|
The chart above shows the percentage of enlistees
falling into each of these three tiers in FY 2007; Tier 1 and Tier 2 are
combined in the civilian comparison group and the Tier 3 proportion is
illustrated separately.
In FY 2007, individuals who chose to enlist were more
likely than the general civilian population to have a high school diploma or
its equivalent: 98 percent of enlistees are classified as either Tier 1 or
Tier 2, whereas only 81 percent of 18- to 24-year-old civilians fell into
this category.
Women who chose to enlist were more likely than their
male peers to have a high school diploma: 90.5 percent of female enlistees
were characterized as Tier 1, whereas only 84.6 percent of male enlistees
fell into this category.
Note: DoD does not assign applicants to the same set of tiers. Many would-be recruits start
the application process while still in school but do not actually enlist
until after graduation.
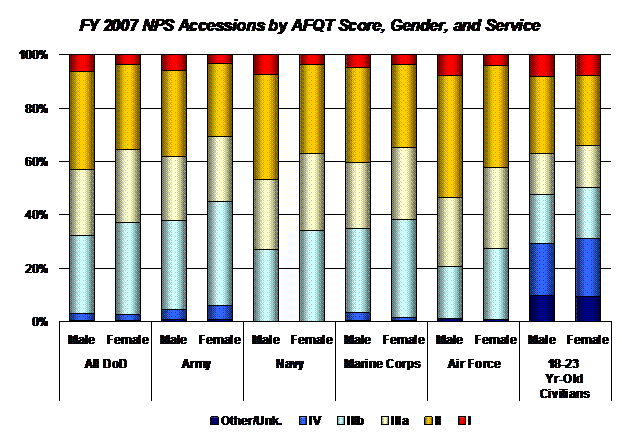
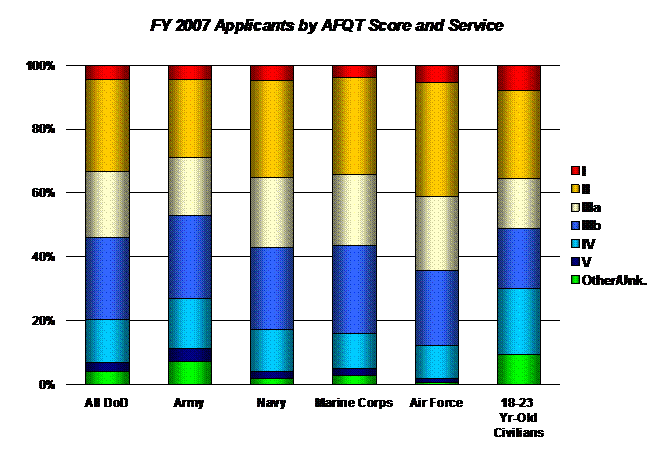
Individuals who enlisted in the armed services during FY
2007 received higher AFQT scores on average than the 1997 civilian control
group. For example, 67 percent of all enlistees scored in the 50th
percentile or higher, while 51 percent of the civilian control group did so.
Women – both enlistees and civilian –
received somewhat lower scores on the AFQT than their male peers. For
example, 68 percent of male enlistees scored in one of the top three
categories, whereas only 63 percent of female enlistees did so.
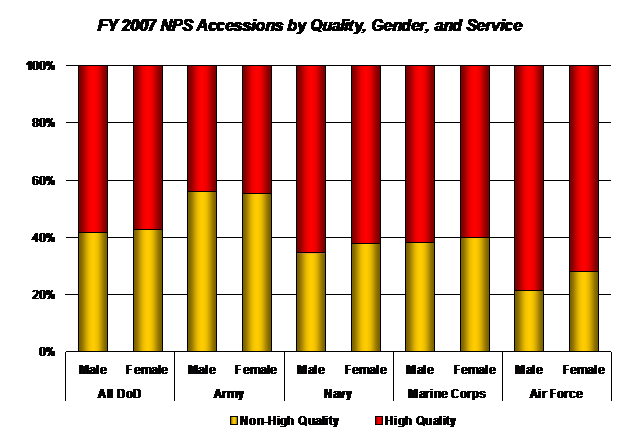
Enlistees
who are at least high school diploma graduates and who score at or above the
50th percentile on the AFQT are considered to be “high
quality” by the DoD. In FY 2007, 58 percent of all enlistees fell into
this category.
For
DoD as a whole, male and female enlistees had very similar probabilities of
being considered “high quality”: 58.3 percent of all male
enlistees and 57.4 percent of all female enlistees fell into this category.
The stronger academic credentials of female enlistees as a group offset their
somewhat lower AFQT scores.
On October 30, 1997, the Office of
Management and Budget (OMB) published “Standards for Maintaining,
Collecting, and Presenting Federal Data on Race and Ethnicity.” These
new standards motivated a sea change in the way DoD reported demographic
information on members of the armed services.
Prior to FY03, data on race and ethnic characteristics were
used jointly to define demographic groups for reporting purposes. The most
common set of mutually exclusive categories was “non-Hispanic
White”, “non-Hispanic Black”, “Hispanic”, and
“Other”.
When information on race and ethnicity is collected now,
individuals are asked to choose one or
more of the following race categories:
|
American Indian or Alaskan Native (AIAN)
|
|
Asian
|
|
Black or African American
|
|
Native Hawaiian or Other Pacific
Islander (NHPI)
|
|
White
|
In a separate question they are also asked to indicate
whether or not they identify themselves as Hispanic.
Since FY03, the Population
Representation in the Military Services report has provided separate
tables for the answers to these two questions. It is important to note that
in some tables of this report, Hispanic individuals who identify themselves
as “White” are grouped
with non-Hispanic Whites in a number of tables that report information by
racial identity. The same approach is also used to report data on other
racial groupings, with the result that Hispanic individuals who identify
themselves as Black (or African American) are reported together with
non-Hispanic Blacks; non-Hispanic Asians are reported together with
non-Hispanic Asians, etc.
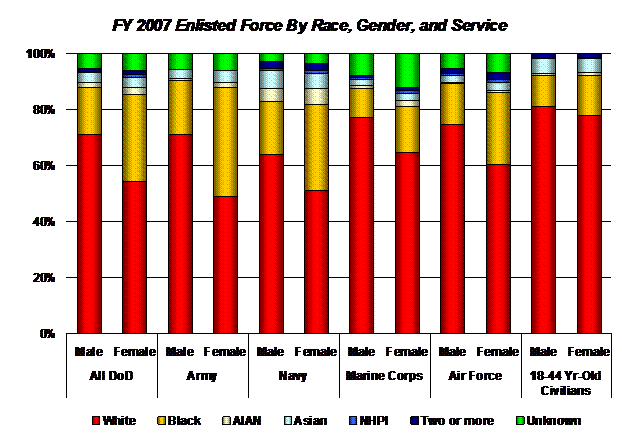
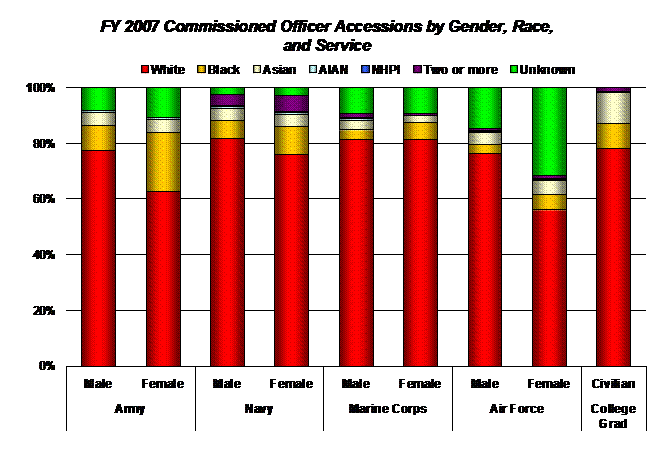
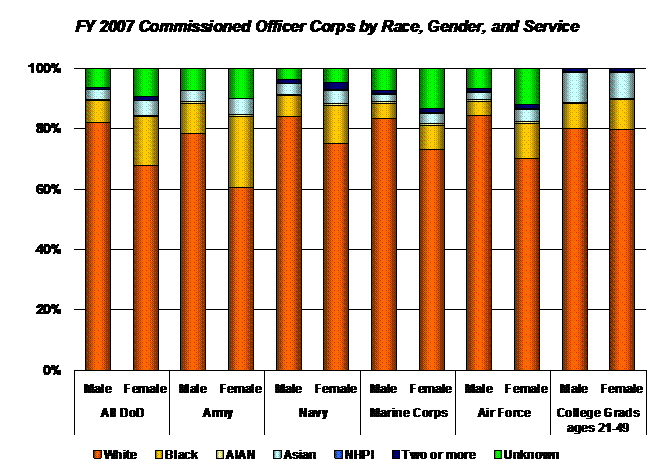
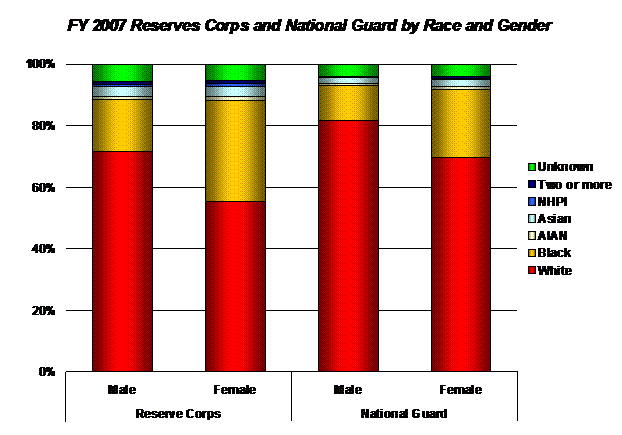
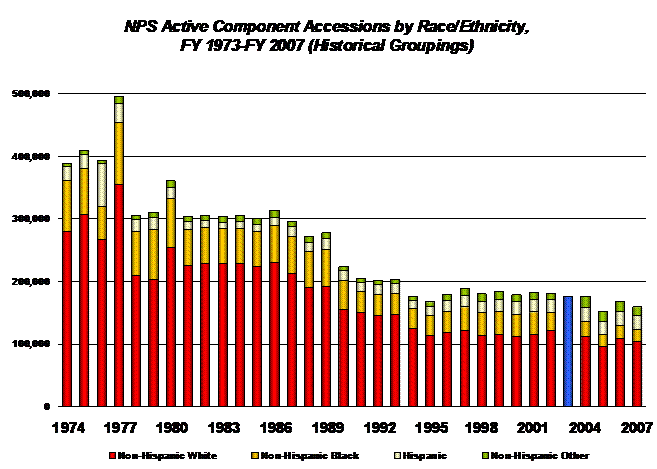
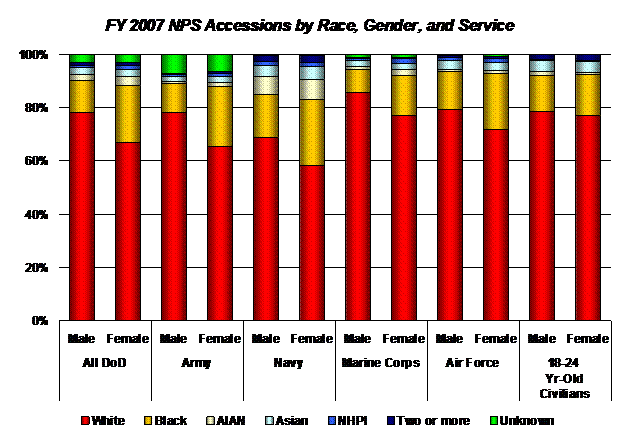
The above chart summarizes the information on racial
identities reported by new recruits during FY 2007. We see that White and
non-White men as a group joined the military at the roughly the same rate:
the relative proportions of White and non-White male accessions were similar
to the racial mix found in the general civilian population. However, minority
women joined the military at a higher rate than their share in the civilian
population would suggest: non-White female accessions accounted for over 33
percent of all female accessions even though less than 23 percent of the
female civilian population fell into this category.
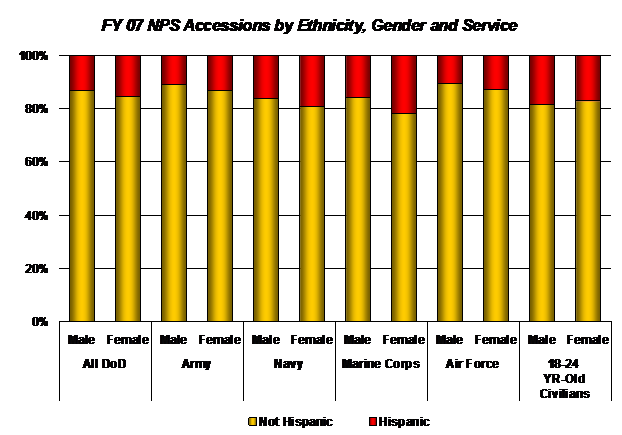
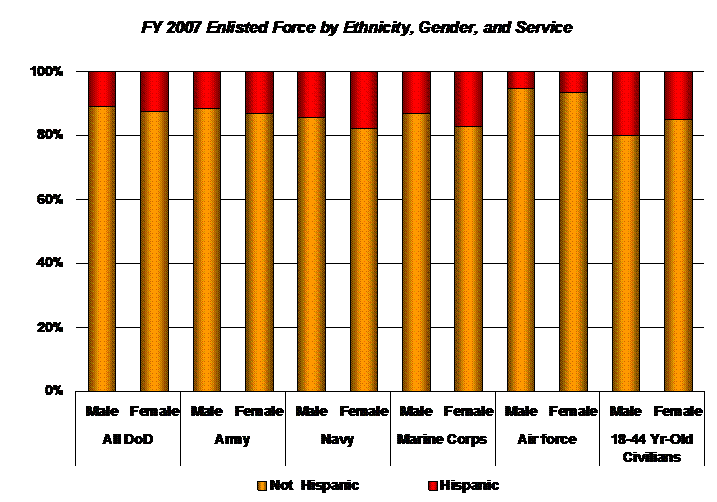
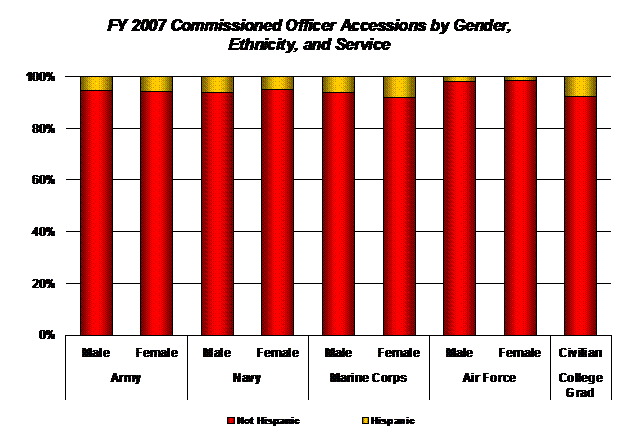
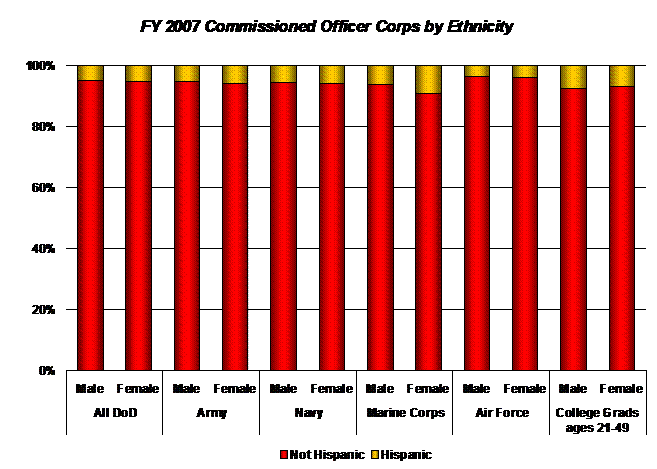
As mentioned above, respondents are asked to
self-identify as either Hispanic or non-Hispanic. The above chart summarizes
the information on ethnicity reported by new recruits during FY 2007. We see
that the Navy and the Marine Corps had the largest proportion of Hispanic
recruits (17 and 16 percent respectively); the Army and the Air Force had the
smallest (11 percent in each case). The average for DoD overall was just over
13 percent, compared with 18 percent for the comparison civilian population.
In each of the DoD active components, female enlisted
recruits were slightly more likely than their male peers to self-identify as
Hispanic: in FY 2007, 15 percent of female recruits and 13 percent of male
recruits classified themselves as Hispanic. This gender-linked difference was
strongest in the Marine Corps, where Hispanic women enlisted at a higher rate
than their share of the general civilian population would suggest: almost 22
percent of female Marine Corps recruits identified themselves as Hispanic
even though only 17 percent of women in the civilian comparison group did so.
The next several charts characterize FY 2007 enlistees by the characteristics
of their respective home communities. To create these charts (and the tables
found in appendix B), we combined information on the home of record reported
by each enlistee with socio-economic data obtained from Claritas on
communities within the U.S.
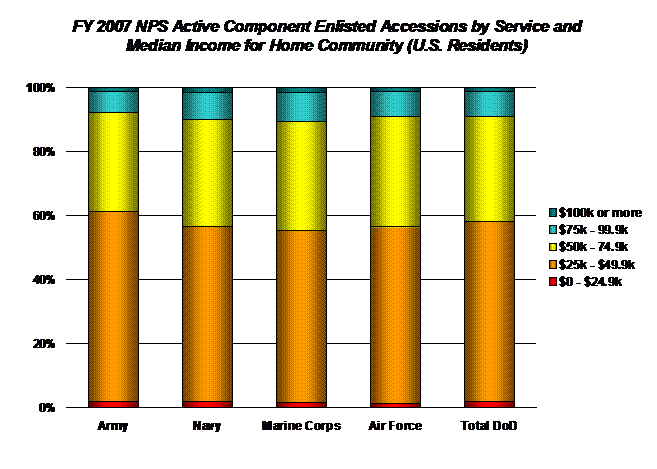
We see that for DoD as a whole, over half (57 percent)
of enlistees with a U.S.
home of record come from communities with a median annual household income of
less than $50,000. The Army had the largest proportion (61 percent) of
recruits in this category; the other three services all had roughly the same
proportion (55-56 percent) of accessions in this group. Very few recruits
come from communities with median incomes of less that $25,000.
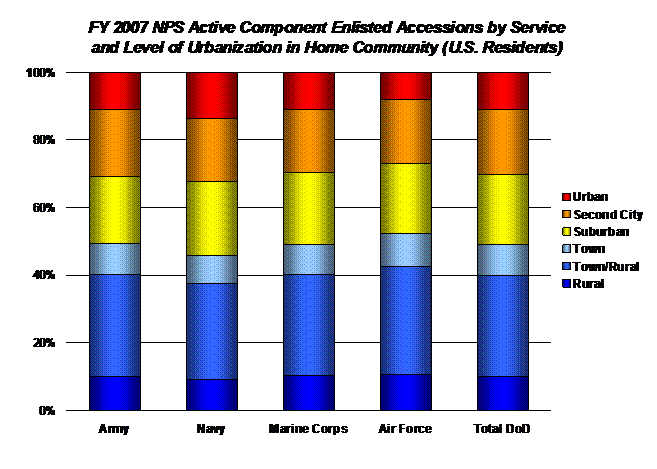
A proprietary Claritas model classifies locations within the U.S.
by both population density and proximity to the downtown core in the nearest
metropolitan area. The result is a set of six categories:
·
Urban: the downtowns of major cities and their
surrounding neighborhoods
·
Second city: less densely populated than urban
areas, and serve as the population center for the surrounding community
·
Suburban: may have a population density
comparable to that found in a second city, but is dependant on a neighboring
population center
·
Town: smaller population center than a second
city with a lower population density
·
Town/rural: areas nearby towns
·
Rural: the remainder of the country
We see that for DoD as a
whole, roughly half of all recruits come from small towns and rural areas.
The Air Force has the largest proportion of recruits in this group (52
percent); the Navy has the smallest proportion (46 percent).
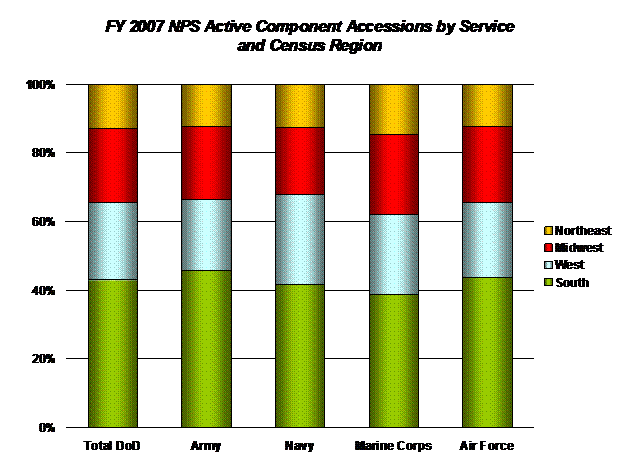
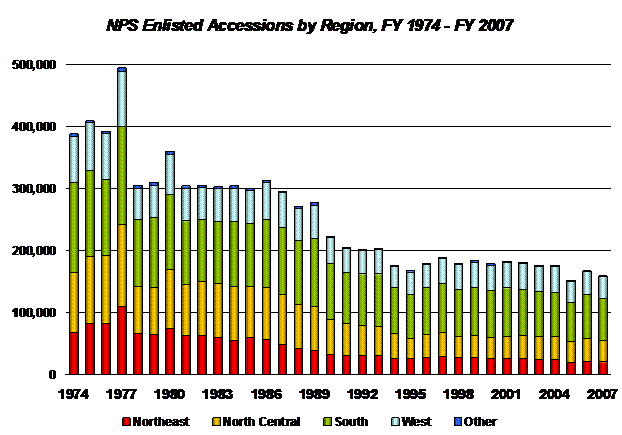
In each of the DoD active components, the largest proportion of FY 2007
recruits came from the south. For DoD as a whole, 43 percent of enlistees
listed a home of record located in the southern region as defined by the U.S.
Census.
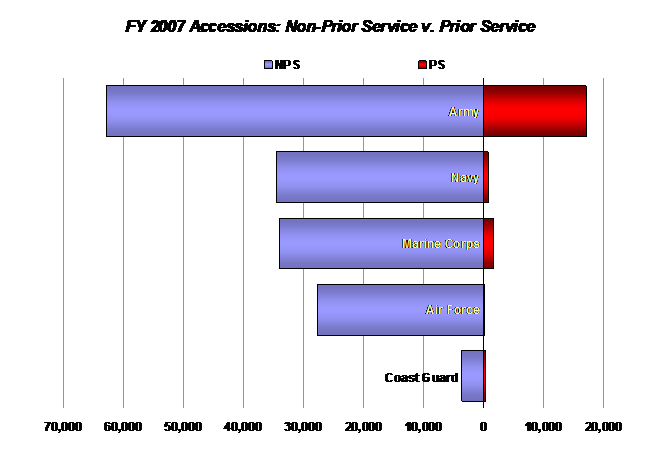
Each year, a significant number of individuals with
prior military experience choose to return to full-time active duty. There
were roughly 20,000 of these “prior service recruits” in FY 2007,
accounting for 11 percent of accessions across all services. The vast
majority of these individuals (85 percent) joined the Army, where they
accounted for 22 percent of accessions. Prior service recruits also accounted
for 5 percent of Marine Corps
accessions and 8 percent of Coast Guard accessions.
It should be noted that the above classification (as
either NPS or PS) is based on a provisional classification done at the time
individual recruits actually “ship” to boot camp. In some years,
a number of recruits are reclassified during basic training.
RETURN to topics list
|