

|
|
|
|
Race/Ethnicity Significant racial/ethnic differences exist among the Services, as shown in Table 2.5. Approximately 34 and 40 percent of Army and Navy accessions, respectively, are minorities, as compared to 29 percent of Marine Corps recruits and 28 percent of Air Force recruits. Overall, the Services’ FY 2002 NPS enlisted accessions include 33 percent minorities.
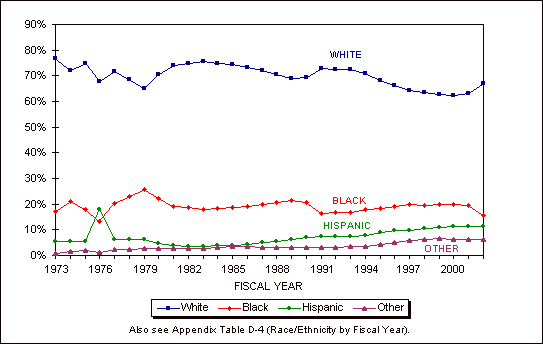
Minority accession proportions must be examined in conjunction with the civilian population. Minority accession proportions in FY 2002 more closely represented the comparable civilian population of 18-24 year-olds than in previous years. In FY 2002, Whites and Blacks were slightly overrepresented (each by about 2 percentage points) and those of “Other” race/ethnicity were equally represented. Hispanics were somewhat underrepresented, by about 4 percentage points. Compared to FY 2001 and earlier, Blacks were less overrepresented in FY 2002. Whites went from slightly underrepresented (since FY 1996) to slightly overrepresented in FY 2002. Hispanics remained somewhat underrepresented. For additional data, see Table D-4 for NPS accession data by race/ethnicity with civilian comparison groups for FYs 1973-2002. Figure 2.2 illustrates the racial/ethnic distribution of enlisted accessions for the 30-year period, FYs 1973–2002.[footnote 20] Understanding the racial/ethnic profiles requires some explanation of events during the years up to 1985, before describing the current situation. The percentage of minority enlisted accessions increased, with some fluctuations, during the years following the end of conscription. The number of Black accessions peaked in FY 1979. Hispanic accessions also peaked in FY 1979 (ignoring aberrant data for FY 1976). Accessions of "Other" minorities, a very small proportion of new recruits, have generally shown a gradual increase from less than 1 percent in FY 1973 to 6 percent in FY 2002. The increase of minorities coincided with a miscalibration of the ASVAB, and consequent drop in the aptitude of accessions, both Whites and minorities, beginning in January 1976. The miscalibration led to erroneous enlistment of many low-scoring applicants. Thus, representation of minorities, particularly Blacks (whose test scores, on average, are generally lower than those of Whites), increased during the miscalibration period. The error was corrected by September 1980.[footnote 21] Revised AFQT and education standards in the early 1980s limited the high minority representation levels of the late 1970s.[footnote 22] Further, youth unemployment increased sharply in the early 1980s, making the military a very attractive employer with substantial benefits during a period of competitive job seeking.[footnote 23] By FY 1983, the proportion of Black recruits had returned to approximately the same level as before the test scoring error (18 percent Blacks in FY 1975). By the mid-1980s, as unemployment levels diminished, a gradual increase in Black accessions had resumed. Not until FY 1987 did Hispanic recruit levels return to FY 1975 proportions. Higher high school dropout rates among Hispanics (27 percent), compared to Whites and Blacks (7 and 11 percent, respectively), confound the recruitment of qualified Hispanic applicants.[footnote 24] The Services have accessed a greater proportion of Hispanics each year since FY 1985, when less than 4 percent of enlistees were Hispanic. Today, more than 11 percent of enlistees are Hispanic.
Figure 2.2. Race/ethnicity of Active Component NPS accessions, FYs 1973–2002. Blacks. In FY 2002, Blacks comprised nearly 16 percent of enlisted recruits, approximately 2 percentage points more than in the civilian population (14 percent). The Navy surpassed the Army in FY 2002 with nearly 18 percent Black accessions (17 percent in the Army.) In the aftermath of Operations Desert Shield and Desert Storm and in the midst of the drawdown (FY 1991), a period of relatively high youth unemployment, there were lower proportions of Black recruits than in previous years. From FY 1992 to FY 2001 there were slight increases in Black accession rates most years, nearly reaching pre-drawdown levels of 21 percent Black accessions. In FY 2002, all Services experienced lower Black proportions in their accessions. This reduction and the corresponding increase in White accessions narrowed the representation gap between the military Services and the civilian population. Some view this demographic shift as the result of differing responses to the September 11th terrorist attacks,[footnote 25] while others view it as more linked to the prevailing economic conditions during FY 2002. While the root causes may never be completely isolated, it is clear that the effect is an FY 2002 accession cohort that more closely reflect society then in previous years. While Black men comprise approximately 14 percent of DoD male recruits, Black women make up almost 24 percent of female recruits (Table 2-5 and Appendix Table B-3). Black women in FY 2002 comprised 28 percent of Army female recruits, 21 percent of Navy female recruits, 14 percent of Marine Corps female recruits, and 22 percent of Air Force female recruits. In comparison, the proportion of Black men ranged from 10 percent of Marine Corps male recruits to 17 percent of Navy male recruits. Hispanics. As the proportion of Hispanics has been increasing in the civilian population, so has the proportion of enlisted Hispanics. However, Hispanics were underrepresented among enlisted accessions in FY 2002, 11 percent of recruits compared to nearly 16 percent of civilian 18- to 24-year-olds. The Marine Corps had the highest proportion of Hispanic accessions (14 percent) in FY 2002, followed by the Navy, Army, and Air Force (12, 12, and 7 percent, respectively). The proportion of Hispanic accessions has increased over the years (Appendix Table D-7). In FY 1983, less than 4 percent of new recruits were Hispanic. Today, more than 11 percent of enlisted accessions are Hispanic. One factor influencing the representation of Hispanics in the military is high school graduation rates; Hispanics are less likely to earn a high school diploma than those in other racial/ethnic groups.[footnote 26] In FY 2002, 60 percent of 18- to 24-year-old Hispanics completed high school (Tier 1) or earned an alternative credential (Tier 2) compared to 75 percent of Blacks and 84 percent of Whites. "Other" minorities. Members of "Other" racial minorities (e.g., Native Americans, Asians, and Pacific Islanders) are 6 percent; they are slightly overrepresented in the Services. The proportion of "Other" minorities ranges from nearly 5 to 9 percent in the Services, with the Navy having the largest percentage. In the civilian population, 5 percent of 18- to 24-year-olds are "Other" racial minorities, an increase of more than 2 percentage points since FY 1981. [Footnote 20] See Appendix Tables D-5 (White Accessions), D-6 (Black Accessions), D-7 (Hispanic Accessions), and D-8 ("Other" Accessions) by Service and Fiscal Year. [back to paragraph] [Footnote 21] Office of the Assistant Secretary of Defense (Manpower, Reserve Affairs, and Logistics), A Report to the House Committee on Armed Services: Aptitude Testing of Recruits (Washington, DC, 1980). [back to paragraph] [Footnote 22] Congressional Budget Office, Social Representation in the U. S. Military (Washington, DC, 1989), p. 54. [back to paragraph] [Footnote 23] Bureau of Labor Statistics. Employment Status of the Civilian Noninstitutional Population, 1940 to Date. URL: ftp://ftp.bls.gov/pub/special.requests/lf/aat1.txt. [back to paragraph] [Footnote 24] See U.S. Department of Education, The Digest of Education Statistics 2002 (NCES 2003-060) (Washington, DC: National Center for Education Statistics, 2002), Table 108; U.S. Department of Education, Dropout Rates in the United States: 2000 (NCES 2002-114) (Washington, DC: National Center for Education Statistics, 2001), Table A; and U.S. Department of Education, Status and Trends in Education of Hispanics (NCES 2003-008) (Washington, DC: National Center for Education Statistics, 2003, pp. 40-41). [back to paragraph] [Footnote 25] Burger, E.C., The Impact of September 11 on Military Enlisted Recruiting (Fort Knox, KY: U.S. Army Accessions Command, Center for Accessions Research, 2003). [back to paragraph] [Footnote 26] See Appendix Table B-8; U.S. Department of Education, Status and Trends in the Education of Hispanics (NCES 2003-008) (Washington, DC: National Center for Education Statistics, 2003), p. 42-43; U.S. Department of Education, Dropout Rates in the United States: 2000 (NCES 2002-114) (Washington, DC: National Center for Education Statistics, 2001), pp. 18-19; and previous Population Representation reports. [back to paragraph] |
||||||||||||||||||||||||||||||||||||||||||||||||||||||||||||||||||||||||||||||||||||||||||||||||||||||||||||||||||||||||||||||||||||||||||||||||||||||||||||||||||||||||
|
|