High Quality
|
|||||||||||||||||||||||||||||
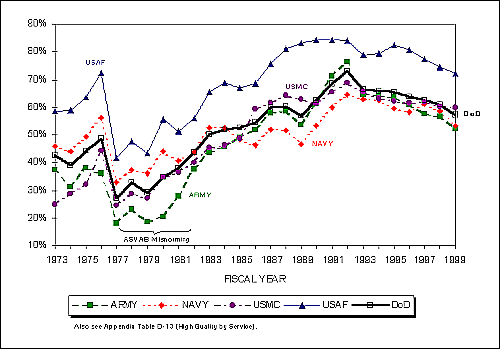
One impact of the defense drawdown is the Services' redesign of a number of career fields with incumbents assuming a more diverse workload and greater responsibilities. [1] The redesign both increases the number of tasks assigned to an individual, and requires incumbents to perform new tasks of greater complexity.The Services believe that as the levels of job/task difficulty and importance increase, so will the need to bring in and retain greater proportions of individuals with above-average aptitude.The Services define high-quality recruits as high school diploma graduates who score in the top 50 percent on the AFQT, Categories I through IIIA.Figure 2.9 shows the trends in the proportion of high-quality accessions since FY 1973.In FY 1999, the percentage of high-quality recruits ranged from 52 percent in the Army to 72 percent in the Air Force.
|
Table
2.8.AFQT Scores of FY 1999 Active Component NPS Accessions, by
Gender and Service (Percent) |
|||||||
|
|
|
|
Marine |
Air |
|
||
|
MALES |
|||||||
|
I |
4.0 |
4.5 |
3.1 |
5.2 |
4.2 |
||
|
II |
30.5 |
34.1 |
33.3 |
44.1 |
34.3 |
||
|
IIIA |
27.9 |
26.9 |
27.2 |
28.6 |
27.6 |
||
|
IIIB |
35.3 |
34.5 |
35.4 |
21.9 |
32.9 |
||
|
IV |
2.3 |
0.0 |
1.0 |
0.2 |
1.1 |
||
|
V |
0.0 |
0.0 |
0.0 |
0.0 |
0.0 |
||
|
Total |
100.0 |
100.0 |
100.0 |
100.0 |
100.0 |
||
|
FEMALES |
|||||||
|
I |
2.6 |
2.5 |
2.9 |
2.6 |
2.6 |
||
|
II |
29.2 |
30.7 |
33.4 |
35.3 |
31.5 |
||
|
IIIA |
33.2 |
28.9 |
31.7 |
32.8 |
31.8 |
||
|
IIIB |
34.3 |
37.9 |
31.7 |
29.2 |
33.8 |
||
|
IV |
0.7 |
0.0 |
0.3 |
0.1 |
0.3 |
||
|
V |
0.0 |
0.0 |
0.0 |
0.0 |
0.0 |
||
|
Total |
100.0 |
100.0 |
100.0 |
100.0 |
100.0 |
||
|
Columns may
not add to total due to rounding. |
|||||||

Figure 2.9.Percentage of high-quality NPS accessions, FYs 1973–1999.
[1] See Sellman, W.S., Since We Are Reinventing Everything Else, Why Not Occupational Analysis? Keynote address to the 9th Occupational Analyst Workshop, San Antonio, TX, May 31–June 2, 1995.