 |
|
|
Characteristics of Active Component Accessions During FY 2001, 182,976 Active Component non-prior service recruits (individuals who had not previously served in the military) and 11,960 prior service recruits (individuals with military experience) shipped to recruit training centers (Table 2.3). This does not include individuals who entered the DEP in FY 2001 but had not been sent to basic training by September 30, 2001, nor does it include Reserve Component recruits (see Chapter 5 for Reserve Component enlisted accession data).
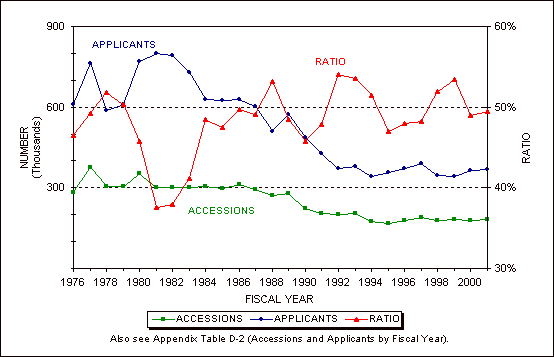
In the Active Components, almost 94 percent of accessions have never served in the military before. The nearly 12,000 prior service accessions representing approximately 6 percent of Active Component enlistees in FY 2001 is larger than last year's cohort of less than 10,000. Prior service accessions are older and more likely to be married than their NPS counterparts. Prior service recruits more closely resemble the Active Component enlisted force—in terms of age and marital status—from which most of them came. In terms of other characteristics, they are similar to their non-prior service counterparts. Additional statistics on prior service accession characteristics (e.g., race/ethnicity, education levels, and AFQT scores) are contained in Appendix B, Tables B-13 through B-22. The remainder of this section examines a number of sociodemographic characteristics of FY 2001 NPS recruits, and compares them with the 18- to 24-year-old civilian non-institutionalized U.S. population. The proportion of accessions to applicants over FYs 1976-2001 is tracked in Figure 2.1. This ratio provides an index of the recruiting market. In the earlier years, recruiters sent far more applicants to MEPSs for processing to achieve recruiting objectives. In FY 1981, more than 800,000 applicants were processed through MEPSs to access approximately 301,000 new recruits, a 38 percent accession-to-applicant ratio. In the early 1980s, the Services implemented a series of management initiatives designed to emphasize quality and reduce overhead costs. Recruiting management objectives and award systems were changed to emphasize types of applicants (e.g., high school diploma graduates, Category IIIA and higher) in contrast to achieving purely numerical goals; enlistment screening tests were devised to estimate ASVAB performance prior to sending an individual to a test site.  Figure 2.1. Number of accessions and applicants with ratio of accessions to applicants, FYs 1976-2001 Over the last decade, recruiters have expended great effort in screening prospects. For most years, progressively fewer prospects were sent to MEPSs. In FY 2001, approximately 370,000 applicants were processed through MEPSs to access nearly 183,000 new recruits, nearly a 50 percent ratio of accessions to applicants, inching upward from the 49 percent ratio achieved in FY 2000.
|
||||||||||||||||||||||||||||||||||||||||||||
|
|
||||||||||||||||||||||||||||||||||||||||||||