 |
|
|
ACTIVE COMPONENT OFFICERS The commissioned officer corps is the senior leadership and management of the Armed Forces. This chapter presents a view of the demographic and social characteristics of the FY 2001 Active Component commissioned officer corps, including separate information regarding newly commissioned officers (i.e., those officers entering the corps for the first time, also known as officer accessions).[Footnote 1] Also highlighted are longitudinal changes among officers. Figure 4.1 illustrates the trend in Active Component officer strength by Service since 1973. Supporting data are provided in Appendix Table D-25.
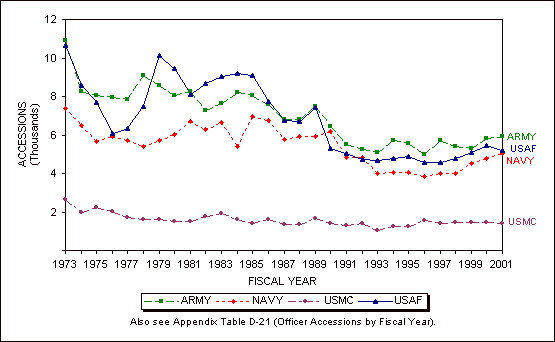
These data depict two drawdowns and one buildup in the Active Component officer corps. The changes in military strength can be attributed, at least partially, to changes in the world situation. The first decline, during the 1973 to 1979 period, occurred during the demobilization following the end of the Vietnam Conflict; the defense buildup of the 1980s was generated by the escalation of the Cold War; and the current drawdown is the result of the fall of communism and the end of the Cold War. The end strength for FY 2001 indicates an end to the drawdown and a return to stability in the Active Component officer corps. At somewhat less than 201,000, the FY 2001 Active Component officer end-strength is only 1,000 smaller than in FY 2000, although it is approximately 69 percent the size of the FY 1986 officers corps, which was the peak of the buildup. The FY 2001 officer end-strength represents the smallest officer corps since the advent of the All Volunteer Force 28 years ago. The overall number of individuals commissioned by the Services remained essentially constant in FY 2001, increasing only slightly to approximately 17,600 (Figure 4.2). This level represents the highest number of accessions since FY 1990.  Figure 4.2. Active Component officer accessions, by Service, FYs 1973-2001. [Footnote 1] Data are for commissioned officers; warrant officers are excluded. A brief sketch of warrant officers is presented at the end of this chapter.[back to paragraph]
|
|
|