|
This is the 24th annual Department of Defense (DoD) report on social representation in the U.S. Military Services. Such a
profile of the social demography of the military was initiated in response to a mandate by the Senate Committee on Armed Services (Report 93-884, May 1974). Since fiscal year (FY) 1975, the Directorate for
Accession Policy, Office of the Assistant Secretary of Defense (Force Management Policy) has provided annual data addressing the quality and representativeness of enlisted accessions and personnel compared to the
civilian population. In keeping with an increased emphasis and reliance on a Total Force, Accession Policy has expanded this report to include statistics not only for active duty enlisted personnel but for
officers and reservists as well. In addition to estimates of cognitive ability, routine demographics (e.g., age, gender, race/ethnicity) are supplemented with
more complex composite measures (e.g., socioeconomic status) and service characteristics (e.g., years of service and pay grade). Further, historical data are included to aid in analyzing trends, and otherwise to
render the statistics more interpretable. Thus quality, representation rates, and the like can be viewed within the context of the preceding decades. These data are invaluable to military personnel policymakers and
analysts as well as others interested in monitoring the qualities and characteristics of the people serving in the Military Services. The aim of the Population Representation
report is to disseminate facts regarding the demographic, educational, aptitude, and socioeconomic levels of applicants, new recruits, and enlisted and officer members of the Active Forces and Reserve Components. Aptitude, education levels, age, race/ethnicity, and gender are among the mainstay statistics that shed light on the formidable task of recruiting. Years of service and pay provide measures of the degree of personnel experience as well as career progress that are particularly informative when examined by gender and race/ethnicity. Indeed this report has increased in volume and coverage over the years but it has not outgrown its usefulness. Representation levels may change only slightly from year to year but monitoring racial/ethnic and gender participation together with additional relevant factors maintains an ever present focus on equal opportunity.
The chapters that follow provide a narrative description with selected tables and graphs, as well as a detailed set of technical appendices addressing many of the traits and characteristics of current
military personnel. This chapter sets the tone and provides some interpretive guidance with regard to the voluminous contents of the Population Representation report.
Fiscal Year 1997: Reflecting on Race and Gender
FY 1997 marks the eve of the 50th
anniversary of the integration of minorities and women in the military. In July of 1948, President Harry S. Truman issued Executive Order 9981 and ended the policy of racially segregating units. A month earlier, in that same year, Congress passed the Women's Armed Forces Integration Act. FY 1997 is also the eve of the 25
th Anniversary of the All Volunteer Force (AVF) at which point the enthusiastic participation of Blacks in the military and the expanded use of women became particularly noticeable. At the
close of FY 1997, the Total Force stood at just over 1.4 million active duty members and more than 902,000 Selected Reservists. Despite further trimming of the force during FY 1997 and a continued rebound in the
number of male youth in the population pool, recruiting remains a challenge. Maintaining the volunteer spirit involves more than relatively low accession requirements and an ample youth population. In the past,
recruiting goals were met in the face of the declining male youth population of the 1980s in large part because of enlistment and retention trends of minorities and women. Data for the past half century are
shown in Figure 1.1, with some projections for the future.
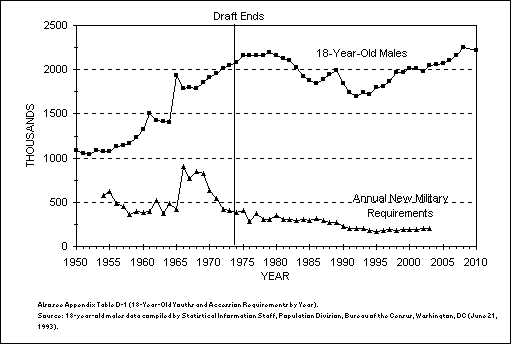 |
Figure 1.1. The population of 18-year-old males and the Services' non-prior service (NPS) recruiting requirements for years 1950-2010 (projected).Diversity continues to grow. Blacks maintain their strong military presence and have even
made gains in the officer corps. Hispanics and other racial/ethnic minorities comprise notable proportions of enlisted members and officers alike. The real representation issue
concerns women. While they comprise half of the youth population, they stand at less than 20 percent of both enlisted and officer accessions. However, these figures are all-time
highs in the representation of women entering the military. Before the AVF, in FY 1964, less than 1 percent of enlisted accessions were women. Women climbed to 5 percent in
1973. Ten years ago, women stood at 12 percent of accessions and as of FY 1997 they accounted for nearly 18 percent of new recruits. At 19 percent, their representation
among officer accessions was even stronger. The representation levels for women among active component enlisted members and the officer corps were also record breaking at 14 percent each.
Remaining Challenges
Volunteers for today's military lifestyle and missions come from a myriad of demographic and social lines and paths: Black, White, and "Other"; North, South, East, and West;
middle class, rich, and poor; married and single; and men and women. This constellation of people train and fight or keep peace in an unstable interwoven world including the volatility
of Bosnia and the lethal potential brought to the fore by nuclear testing in India and Pakistan. Just as the missions are far from routine or traditional, neither is the mix of soldiers, sailors,
marines, or airmen. Women and minorities have climbed proportionately since the passage of the Women's Armed Forces Integration Act and President Truman's racial integration executive order.
Representation is in many ways a success story. Remaining challenges include increasing integration of women and minorities. Progress and equity for women and minorities must
go beyond numerical representation and consider factors related to career progression, including occupational assignment, retention, and promotion patterns, in addition to zero
tolerance for a hostile work environment. Fifty years ago, minorities and women were given a permanent role in the military.
Today's volunteer military relies upon the resultant multicultural cadre of quality men and women who stand ready to carry out missions at home and around the globe. In the
interest of military cohesion, morale, and readiness in the 21st century, progress toward equitable access to the risks and rewards of military service must continue. Data Sources
The primary sources for this report are computerized data files on military personnel maintained by the Defense Manpower Data Center (DMDC). In addition, the Bureau of
Labor Statistics (BLS) provides the bulk of the comparison data on the national population. Though the data sources have remained constant, refinements have been made
over the years, most of them in regard to the civilian comparisons. Starting with the report for FY 1994, Census data were adjusted to provide a more accurate comparison for military applicants and accessions
(yearly average rather than last month of the fiscal year). Age comparisons for prior-service enlisted accessions to the Selected Reserve were
also adjusted, from the 18-44 year-old civilian labor force to the 20-39 year-old civilian labor force. Comparisons for Selected Reserve enlisted members were changed from
18-44 year-old civilians to 18-49 year-olds. Starting with data for FY 1995, a further age refinement was introduced for comparisons with the officer corps. Previously the
comparison group for Active Component officers comprised civilian workforce college graduates who were 21 years and older. This was adjusted by establishing an upper
bound at age 49, making the more precise comparison, college graduates aged 21 to 49 who are in the workforce. In addition, beginning with the FY 1995 Population Representation
report, DMDC provided edited, rather than raw, data on applicants for enlistment. With this report, prior service accession data for the Active Component have
been added. A brief description of the data sources for FY 1997 follows:
| Subject |
Data Source |
| Active Components |
|
Applicants to Enlisted Military
|
DMDC Military Entrance Processing Command (USMEPCOM) Edit Files, October 1996 through September 1997 |
|
|
DMDC USMEPCOM Edit Files, October 1996 through September 1997 |
|
|
DMDC Active and Loss Edit File, September 1997 |
|
|
DMDC Officer Gain Files, October 1996 through September 1997 |
|
|
DMDC Officer Master and Loss Edit File, September 1997 |
Recruit Socioeconomic Status
|
DMDC Survey of Recruit Socioeconomic Backgrounds, October 1996 through September 1997 |
| Reserve Components |
|
Selected Reserve Enlisted and Officer Accessions
|
Reserve Components Common Personnel Data System (RCCPDS), October 1996 through September 1997 |
Selected Reserve Enlisted Force and Officer Corps
|
Reserve Components Common Personnel Data System (RCCPDS), September 1997 |
| Civilian Comparisons |
|
Civilian Comparison Groups for Applicants, Accessions, and Active and Reserve Members
|
Bureau of Labor Statistics Current Population Survey Files, October 1996 through September 1997 |
Civilian Socioeconomic Comparison Data
|
Bureau of Labor Statistics Current Population Survey Files, October 1996 through September 1997 |
Civilian Comparisons for Military Entrance Test Data
|
Profile of American Youth
(Washington, DC: Office of the Assistant Secretary of Defense [Manpower, Reserve Affairs, and Logistics], March 1982). |
Go to Chapter 2 |
