


|
|
|
|
High Quality One impact of the defense drawdown was the Services' redesign of a number of career fields with incumbents assuming a more diverse workload and greater responsibilities. The redesign both increased the number of tasks assigned to an individual, and required incumbents to perform new tasks of greater complexity. The Services believe that as the levels of job/task difficulty and importance increase, so will the need to bring in and retain greater proportions of individuals with above-average aptitude.[footnote 38] The Services define high-quality recruits as high school diploma graduates who also score in the top 50 percent on the AFQT, Categories I through IIIA. Figure 2.9 shows the trends in the proportion of high-quality accessions since FY 1973. In general, sharp increases in high-quality recruits correspond to periods of rising youth unemployment.[footnote 39] In FY 2002, the percentage of high-quality recruits ranged from 57 percent in the Army and Navy to 75 percent in the Air Force.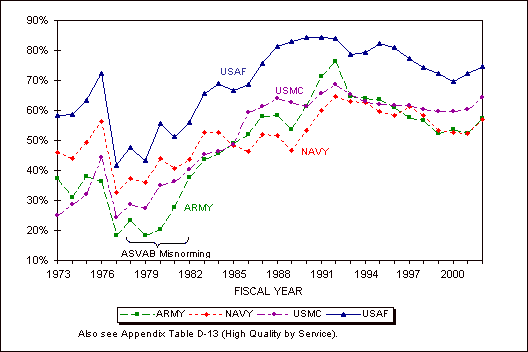 Figure 2.9. Percentage of high-quality NPS accessions, FYs 1973–2002. [Footnote 38] See
Sellman, W.S., Since We Are Reinventing Everything Else, Why Not Occupational
Analysis? Keynote address to the 9th Occupational Analyst Workshop,
San Antonio, TX, May 31–June 2, 1995. [back
to paragraph] |
|
|